![]() This guest post from Sofia Parfenovich, Data Scientist at Altoros Systems, a big data specialist and a Hortonworks System Integrator partner. Sofia explains she optimized a customer’s trading solution by using Hadoop (Hortonworks Data Platform) and by clustering stock data.
This guest post from Sofia Parfenovich, Data Scientist at Altoros Systems, a big data specialist and a Hortonworks System Integrator partner. Sofia explains she optimized a customer’s trading solution by using Hadoop (Hortonworks Data Platform) and by clustering stock data.
Automated trading solutions are widely used by investors, banks, funds, and other stock market players. These systems are based on complex mathematical algorithms and can take into account hundreds of factors. Today’s trading platforms can notify people about the right time for placing buy/sell orders or can even make a deal without any human involvement.
Stock trading strategies and data issues
Trading algorithms are often based on a single set of rules with fixed parameters—easy to implement, they are however unable to reflect all changes within the market and may bring significant loss. One of the ways to make a system more flexible is to divide strategies into several groups based on the types of market conditions.
Here’s an example where this system was implemented. The company had a solution that automatically generated a pool of trading strategies, however the process of selecting the necessary strategy was still an issue. The data was grouped by trading experts manually for a particular state of a stock exchange, which took weeks of analysis. This part of the system needed to be automated.
Another problem was caused by a distributed nature of the system. Several reports for building strategies were aggregated on separate machines. Total size of this information approached 100 GB, making this a big data issue. Furthermore, the strategies should have been revised each two months to get adapted for the changing market conditions.
To cope with such massive amounts of data, the customer’s platform used a number of filters that reduced the number of parameters. As a result, the total size of these aggregated reports was narrowed down to 5–10 GB. After that, the data was divided into groups according to assumptions suggested by trading experts. So, the necessary strategies were selected from smaller sets sized 0.5–1 GB.
However, the resulted strategies were not diverse enough and very often omitted some of the essential parameters. The customer wanted to include more information into analysis—the goal was to make decisions more precise and therefore increase profits.
Solving the big data problem with Hadoop, Hortonworks Data Platform, and k-means
The task perfectly fit the MapReduce principle (“divide and distribute”) and Hadoop capabilities of the Hortonworks Data Platform. The customer agreed on this option, since it did not require purchasing any additional hardware or software. The reports were uploaded to HDFS. To cluster this aggregated data, the k-means algorithm was implemented using the R language. This algorithm groups objects by coordinate proximity. Figure 1 demonstrates how generated strategies can be coupled together by two parameters (coordinates)—for instance, the probability of getting a profit and the rate of loss. Each color indicates a group of strategies with similar probability of a profit and loss.
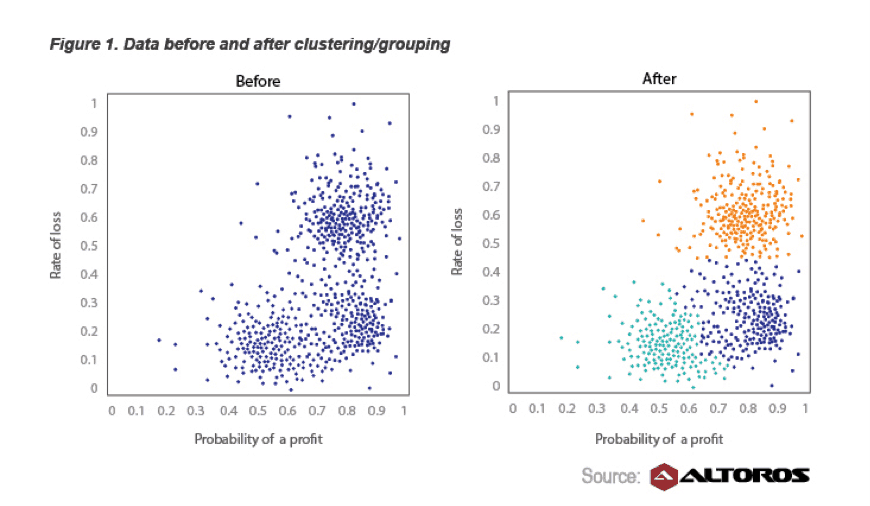
In reality, there is an abundance of factors that influence the stock market, which makes this kind of clustering more sophisticated. For our system, each trading strategy would have N coordinates on the first run (when statistics-related data is analyzed) and M coordinates on the second run (when effectiveness of a strategy is analyzed).
Figure 2 describes how the trading system was improved by using Hadoop (Hortonworks Data Platform), and the k-means algorithm.
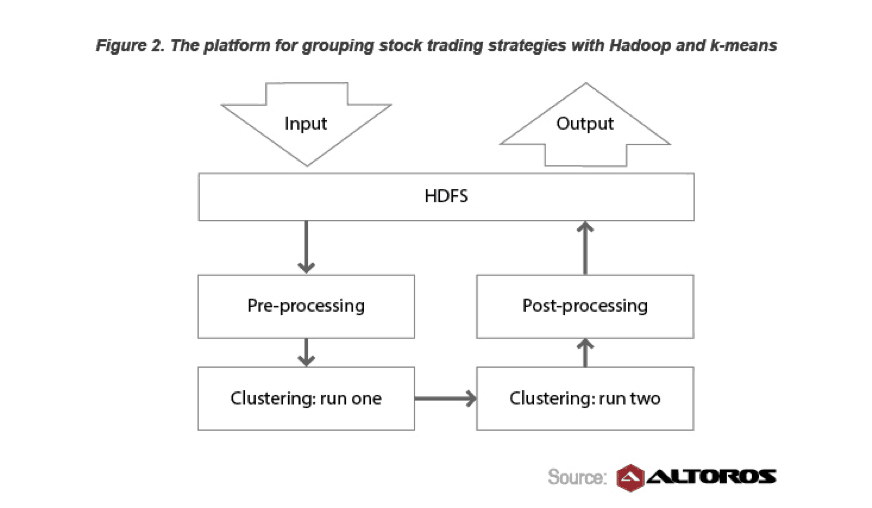
Below is the general schema of the solution:
- First, the system collects reports with raw stock data.
- After that, these reports are transferred to HDFS.
- A script written with the R language starts pre-processing data. (Based on the MapReduce principle, it unifies heterogeneous information collected by the system.)
- On the first clustering run, all strategies are sorted according to the statistics criteria (for instance, the current bid, the amount of stocks, and hundreds of other parameters).
- On the second clustering run, the system performs qualitative analysis: it measures the results each strategy demonstrates and compares the strategy against the state of the market at different periods of time.
- Data is prepared in the appropriate format. Like in the pre-processing stage, this task is also performed by a script created with R upon the MapReduce paradigm.
- The results are retrieved from HDFS and are ready for future usage by the customer.
Analyzing the outcome: build and create strategies 20% faster
Three key benefits were obtained due to optimization with Hadoop, R scripts, clustering, and k-means:
- The system now builds and selects the most suitable strategy 20% faster than before. This improvement alone saves the customer about a week every time the team does the analysis.
- The enhanced platform doubled the number of strategy groups. This diversification made the selection more flexible and concise, increasing the customer’s revenues by 12%.
- Last, the strategies can now be updated more frequently and can include more parameters in the analysis. As a result, there are more strategies the customer can sell, creating an additional revenue channel.
Previously, these achievements were not feasible, since adding a parameter to the system would increase the number of reports and time needed to process them. The current Hadoop-based architecture takes into account the ever growing volumes of market information and allows for processing 10x larger sets of data without any additional investments.
It would also be interesting to see how much improvement the customer could achieve with one of the Hadoop–GPU implementations or with YARN‘s real-time capabilities provided by Hadoop 2.0. So, let’s wait for success stories supported by exact figures.
About the author:
Sofia Parfenovich is a Data Scientist at Altoros Systems, a big data specialist and platform-as-a-service enabler. Sofia is interested in creating association rules for mining large volumes of data with Hadoop and other MapReduce tools. She has strong experience in time series forecasting, building trading strategies, and various data analysis.
Altoros Systems is a Hortonworks System Integrator partner. The company provides technology services around Hadoop and PaaS to software vendors, IaaS providers, and information-heavy enterprises. Altoros has a proven track record of serving technology leaders, such as RightScale, Couchbase, NuoDB, Joyent, Cisco, etc. For more, please visit www.altoros.com.
The post Building Stock Trading Strategies: 20% Faster with Hadoop appeared first on Hortonworks.